STM32 Debugging
Welcome to the blog of STM32 Debugging Techniques

Debugging
What is Debugging, Dec 6, 2022
Debuging describes the the process of identifying and removing errors from computer hardware or software.
In the case of embedded systems, it involves both hardware and software. However, we will only cover software debugging here.
The microcontroller of choice for exploring this topic is the STM32, and the following are a few of the debugging options offered by the (Eclipse-based) STM32CubeIDE:
- Stepping - allows code to be executed one line or one block at a time.
- Single Stepping - executes the current line and goes to the next (will enter function calls).
- Stepping Into - enters function calls for line by line execution.
- Stepping Out - executes an entire function and stops at the line after the call.
- Stepping Out - executes the remaining section of a function and stops where it was originally called.
- Disassembly Window - this view shows the generated assembly mnemonics. The op codes can also be shown. It can be used to debug optimizations done on code.
- Register Window - this view shows the contents of the CPU registers.
- SFR Window - this view shows the contents of the Special Function Registers (peripheral specific registers - from 0x4000_0000 to 0x6000_0000). The registers can also be written to in this view.
- Memory Browser - this view allows the viewing of data in any address. The data can then be downloaded and saved to file for later analysis.
- Expression and Variable Windows - these views show the data stored in a variable. The expresssion window can perform calculations on that data to give more useful information.
- Breakpoints - these are used to mark code addresses where code execution is to be halted/stopped for memory, register or variable investigation.
- Data watch Points - they halt/stop the execution when a specified variable is read or written. It is useful when code has multiple contributors.
- Call Stack & Fault Analyser - this view shows any expressions thrown and the functions call stack prior to an execution halt.
The above debugging tools do not require much setting up and are pretty straight-forward to use. There are 3 other debugging techniques, that require a bit of setting up:
- Serial Wire View (SWV) - (Cortex M3/4/7 only) allows for system tracing with minute performace impact.
- Open On Chip Debugger (Open OCD) & Semihosting - allows sending text to the host machine using printf.
- SEGGER SystemView - real-time recording and visualization tool that reveals the true runtime behavior of an application.

Need for SWV
Why use Serial Wire View, Dec 6, 2022
Application traces are detailed records/logs of the actions performed by the application, and of messages about events that occurred during operation of the application. They are important in the debugging phase of an application.
Standard output peripherals (eg UART) may be used to get the trace from the MCU, however, this solution is normally intrusive because of the following reasons:
- Interrupt-driven - the frequency of interruptions may be very high resulting in performance that is different from the real-world case.
- Polling-driven - the waiting time for transmission alters the performance even more.
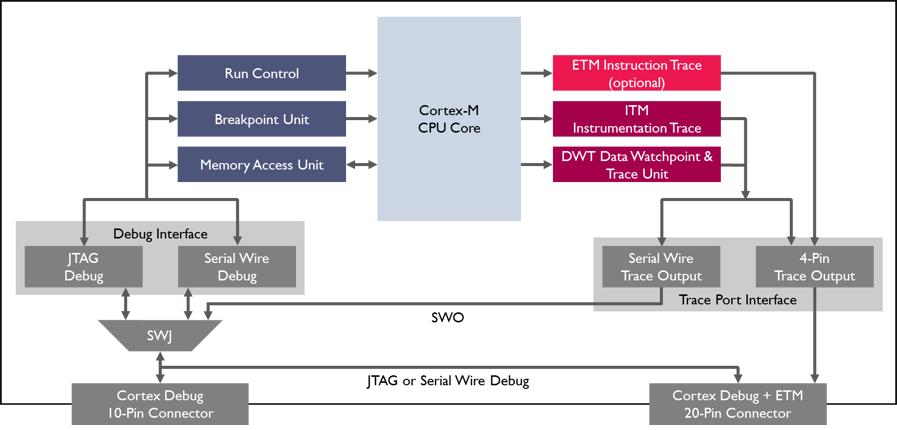
The SWO (Serial Wire Output) trace pin is a hardware feature of ARM Cortex M3 and above, that addresses this problem. It allows the tracing of system activities and memory without having big impaction on the performance.
Working of SWV
How the SWV trace works, Dec 6, 2022
SWD (Serial Wire Debug) is a 2-signal interface (SWDIO, SWCLK) which is one of the features of the Arm CoreSight™ debug and trace technology. It is ARM's alternative to the de facto debugging standard, JTAG, which is a 4-signal interface (TCK, TMS, TDI, TDO).
Contrary to JTAG, which chains TAPs together, SWD uses a bus called DAP (Debug Access Port), which connects the Debug port (DP) to multiple Access Ports (AP). There are three different Debug Ports available to access the DAP:
- JTAG Debug Port (JTAG-DP) - uses the standard 4-signal JTAG interface and protocol to access the DAP.
- Serial Wire Debug Port (SW-DP) - uses the 2-signal SWD protocol to access the DAP.
- Serial Wire / JTAG Debug Port (SWJ-DP) - can use either JTAG or SWD to access the DAP with the TMS and TCK JTAG signals reused to transfer the SWDIO and SWDCLK signals respectively.
ARM Cortex M3 and above have an internal peripheral known as the Instrumentation Trace MacroCell (ITM) which allows sending software-generated debug messages through a specific signal I/O named Serial Wire Output (SWO).
When using SWD, the TDO signal of the SWJ-DP can be used to provide trace event messages via the Serial Wire Output (SWO).
SWV (Serial Wire Viewer) is the protocol used on the SWO pin to exchange data with the debugger probe. Its communication speed is proportional to the MCU speed. To properly decode the bytes sent over the SWO pin, the host debugger needs to know the frequencies of the CPU and SWO pin.
The protocol allows for upto 32 channels (referred to as "stimulus ports") to allow for categorizing of data.
For SWV to be used, the debugger probe must have the SWO pin exposed. Any original ST’s board has an integrated ST-LINK/V2 debugger which supports SWO to trace ITM outputs on Cortex-M3 and above. That debugger can be used to program and debug an external MCU on other board.

SWV Data logging Trace
Code for SWV Data logging, Dec 6, 2022
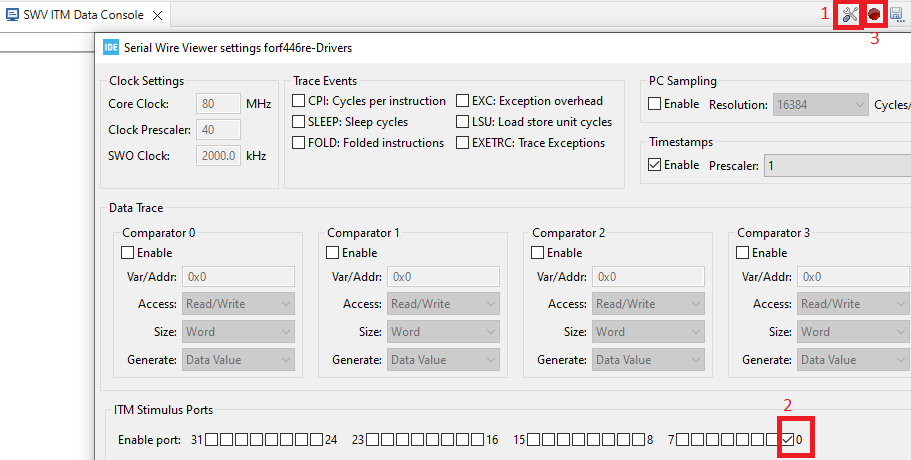
The ITM peripheral like every other peripheral must be enabled before use. The chosen stimulus port must also be enabled.

Then code for sending characters to the ITM buffer is required as shown below:

Then the low-level weak _write() function defined in syscalls.c is overridden to use ITM_SendChar() instead of __io_putchar(). The _write() function is called by printf() which is prototyped in standard libraries {stdio.h}.

The code files can be found here (.c and .h) and added to the code base appropriately.
Note: (Some troubleshooting pointers if it does not work)
- The printf strings need to end with a "\n" in order for the IDE to print it out.
- The SWO pin must NOT be used for another function (check the datasheet for the SWO pin).
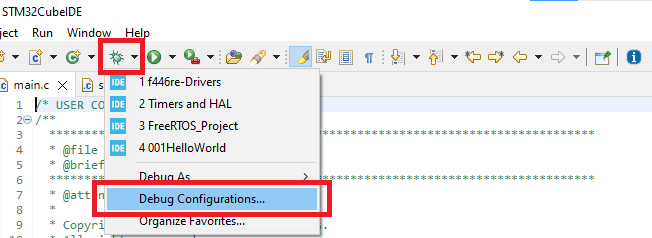
SWV IDE setup
Setup for SWV Data logging viewing, Dec 6, 2022
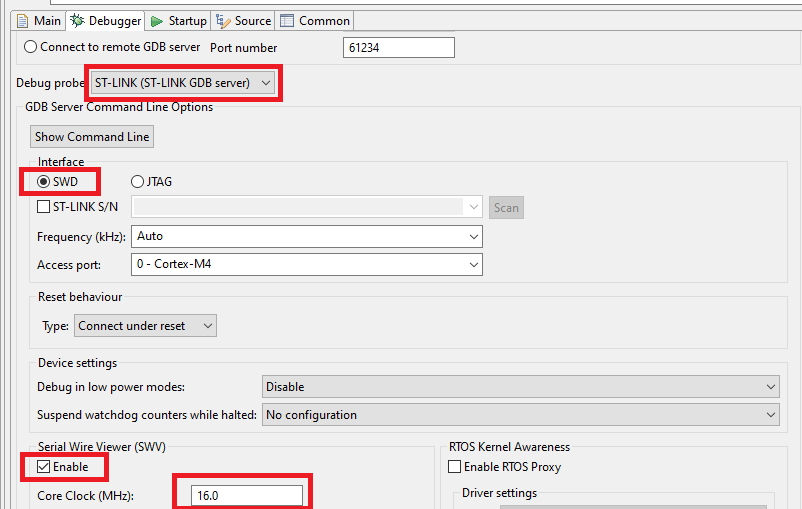
This section provides the procedure of setting up STM32CubeIDE for receiving and displaying the trace. The following image shows the debug configuration required for the project:
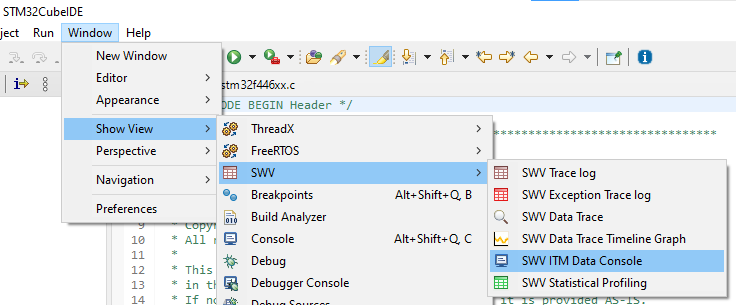
The following image shows how to open the SWV window:
The following image shows the SWV configuration:
